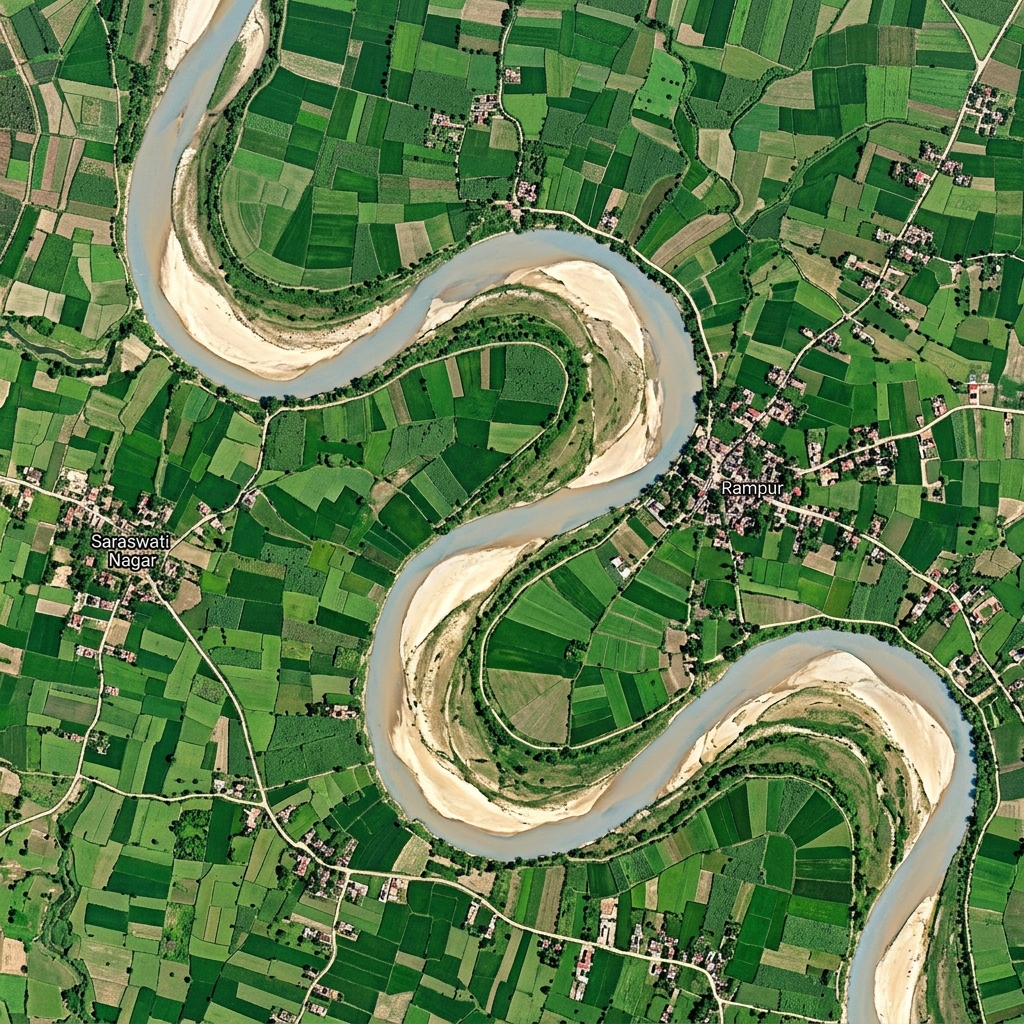
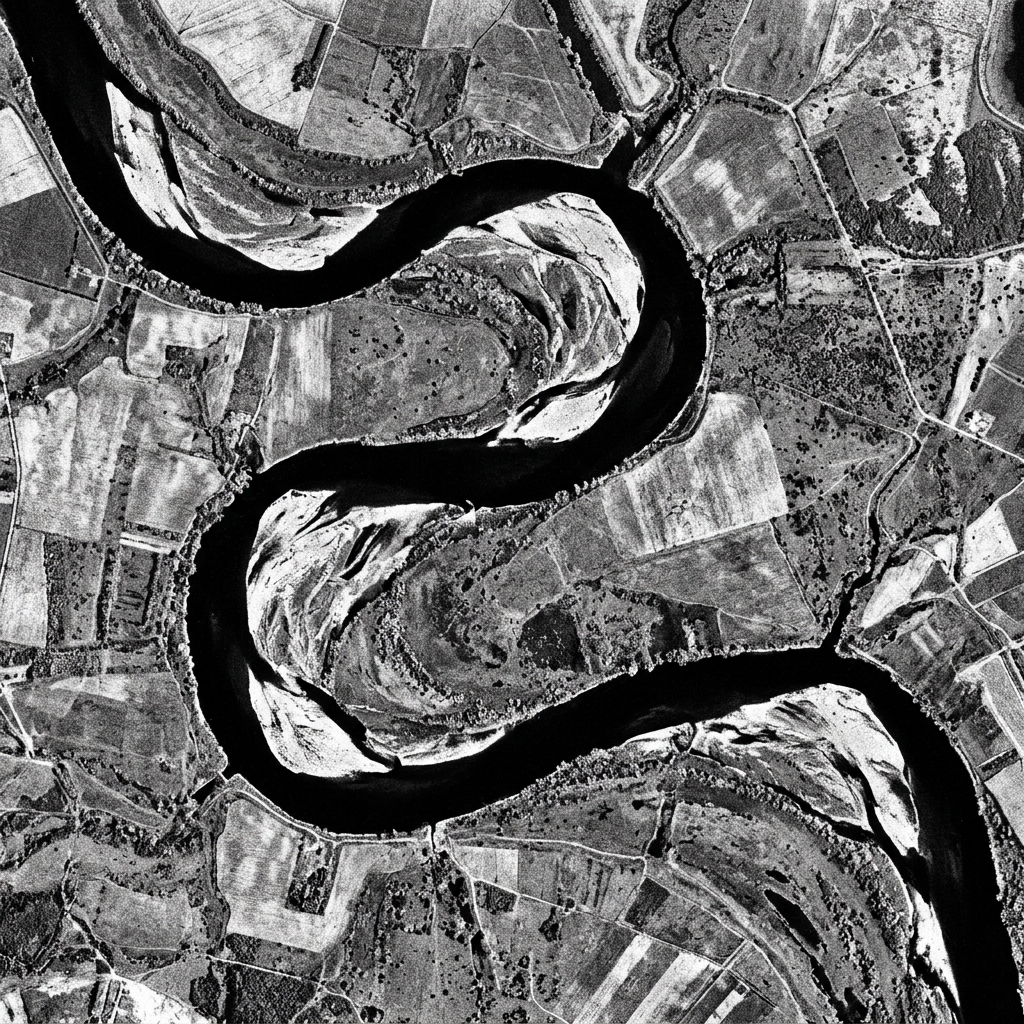
Sentinel-1 SAR · Sentinel-2 · ESA Copernicus India's Rivers

Satellite Chambal river satellite view evidence River aerial view for
India's rivers.

Sentinel-1 SAR radar + Sentinel-2 optical analysis flags sand-mining anomalies before the sandbar disappears — for lawyers, journalists, and local communities. Free and open.

⚖️ Every flag is a satellite-derived anomaly, not a confirmed finding. Revisit cadence improving toward ~6 days. All imagery dated.
4 River Stretches Monitored
SAR Anomalies Flagged
1 GEE-Validated Case
~6-day Revisit Cadence
Free Open Source (MIT)
🛰️ Chambal · SAR Δ +28.0 dB · 91.8 ha anomaly · NDWI sandbar reduction detected · ~91k m³ sand removed (est) 📡 Yamuna · Agra/Mathura · SAR backscatter anomaly · NDWI channel morphology shift detected 📡 Ken · Banda, UP · SAR Δ +36.4 dB · 172 ha flagged · Borders Panna Tiger Reserve catchment 📡 Ganga · Haridwar · SAR Δ +32.8 dB · 115 ha anomaly · Rajaji National Park buffer ⏱ ~6-day SAR revisit · Sentinel-1/Sentinel-2 via GEE · Every flag requires human verification 📄 Satellite imagery is the primary evidence · Court records are corroborating context · MIT Open Source 🛰️ Chambal · SAR Δ +28.0 dB · 91.8 ha anomaly · NDWI sandbar reduction detected · ~91k m³ sand removed (est) 📡 Yamuna · Agra/Mathura · SAR backscatter anomaly · NDWI channel morphology shift detected 📡 Ken · Banda, UP · SAR Δ +36.4 dB · 172 ha flagged · Borders Panna Tiger Reserve catchment 📡 Ganga · Haridwar · SAR Δ +32.8 dB · 115 ha anomaly · Rajaji National Park buffer ⏱ ~6-day SAR revisit · Sentinel-1/Sentinel-2 via GEE · Every flag requires human verification 📄 Satellite imagery is the primary evidence · Court records are corroborating context · MIT Open Source
Anomaly Monitor · Live Polling · 30s refresh

SAR Anomaly Monitor

Sentinel-1 radar + Sentinel-2 optical analysis. Pulsing zones show flagged SAR anomaly footprints at real NGT-documented coordinates. Data polled from dashboard.json every 30 seconds.

⚖️ "Anomaly detected" never means "confirmed illegal." These zones show where the pipeline flagged unusual radar backscatter — human investigation is always required.
Data Generated
Loading...
Segments Monitored
Anomalies Flagged
Next Poll In
30s
Imagery Source
ESA Copernicus · Open
Polling dashboard.json…

Loading anomaly data…

Satellite Evidence · All 4 Segments

What the Satellite Saw

Before/after Sentinel-2 true-colour, Sentinel-1 SAR, NDWI sandbar maps, and NDWI difference images showing actual physical soil reduction on India's rivers. All imagery: ESA Copernicus Sentinel-1/2 — open licence, served locally via GEE pipeline. Court records are corroborating context — satellite data is the evidence.

Loading satellite imagery…

Case Files · GEE-Validated

Satellite
Evidence

Sentinel-1 SAR backscatter anomalies + Sentinel-2 NDWI sandbar morphology changes — actual physical evidence of riverbed alteration. Sand volume loss estimates and channel shift measurements derived from satellite imagery. 4 segments · All GEE-validated · Court records are corroborating context, not primary proof.

Transparency

How It Works

01

SAR Backscatter

Sentinel-1 C-band radar detects metal equipment and vessels on sandbars. Log-ratio anomaly between a seasonal quiet-state baseline and target pass. Flagged area = statistically unusual radar return.

Sentinel-1 GRD · VV · 10m
02

NDWI Morphology

Sentinel-2 NDWI water/sandbar mask tracks exposed sandbar area vs. a seasonal baseline. Flags deviations beyond the historical range for that specific segment and month — not a global threshold.

Sentinel-2 · NDWI · 10m
03

Hedged Scoring

Two-signal fusion into NONE / LOW / ELEVATED / UNDER_REVIEW. The system never outputs "confirmed illegal." Confirmation is always a human, legal, or journalistic judgment — not an algorithm.

Anomaly Scorer · Not a legal tool
What this platform does NOT claim
  • NOT riverbed depth or volume extracted — SAR does not see through water
  • NOT near-real-time — see acquisition dates on every layer
  • NOT "illegal mining confirmed" — anomalies require human verification
  • NOT sub-meter commercial optical — we use free Copernicus data at 10m
  • NOT a replacement for state enforcement
  • NOT black-box AI — transparent, documented statistical method
Data Sources & Credits
ESA CopernicusSentinel-1 SAR (C-band, GRD)
Sentinel-2 Optical (10m)
Open licence
Google Earth EngineProcessing pipeline
Free tier
NASA FIRMSThermal anomaly reference
Fires/kilns — not mining detection
Global Forest Watch (WRI)Forest alert reference layer
Credited — not River Watch's own detection
National Green TribunalCourt orders — primary evidence
Public record